The Correlation study is a statistical measure of how two symbols move in relation to each other.
The Correlation is computed into what is known as the correlation coefficient, which ranges between -1 and +1. Perfect positive correlation, a correlation coefficient of +1, implies that as one symbol moves, either up or down, the other security will move in lockstep, in the same direction. Alternatively, a perfect negative correlation, -1, means that if one symbol moves in either direction, up or down, the symbol symbol that is perfectly negatively correlated will move in the opposite direction. If the correlation is 0, the movements of the securities are said to have no correlation.
Pane: Bottom
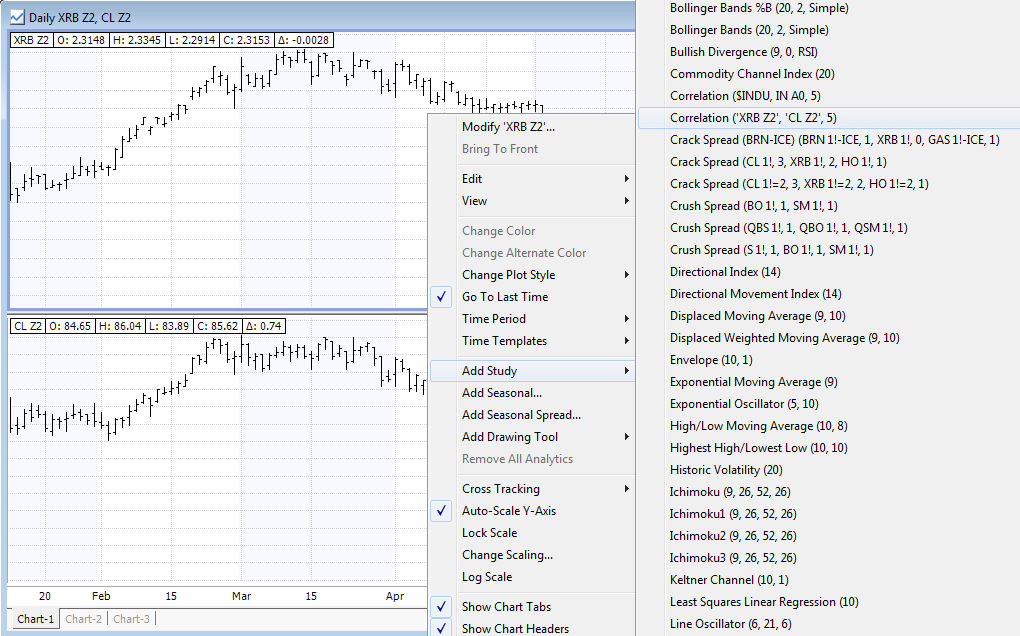
The Correlation study defaults with $INDU and IN A0 as its symbols. However, if the chart contains 2 or more symbols, you will have a second Correlation study within the studies list, allowing you to apply the study to the first 2 symbols present on the chart.