The new Portfolio Analysis component provides users the ability to perform multi-factor analysis across and within portfolios of positions. New visualizations allow users to see portfolios in aggregate or grouped by various factors (Sector, Industry, Asset Class, etc), and drill down into the individual holding.
Portfolio Analysis Component
Similar to other Connect components, the Portfolio Analysis component can be easily added to a user’s workspace and configured in many ways to suit an individual’s needs and tastes. Its design focuses on data organization and visualization allowing users to quickly analyze a portfolio and drill in to identify outlying situations of which would require attention. Its integration with other Connect components allows users to efficiently dig deeper to perform further analysis and research facilitating the investment decision making process.
Component Geography
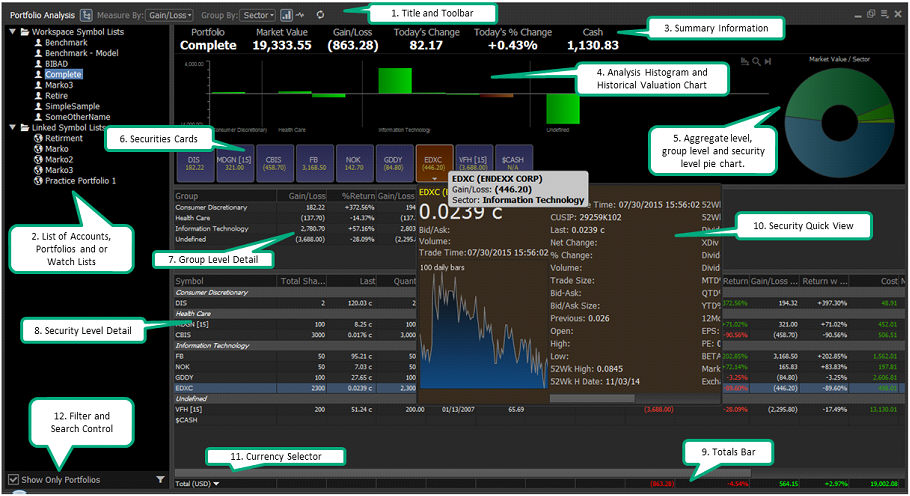
1. Title and Toolbar – consistent with other Connect components, the title and toolbar present high level controls for the Portfolio Analysis component.
2. List of Accounts, Portfolios and/or Watch Lists – Displays a list of all of a user’s Accounts, Portfolios and/or Watch Lists. Depending on the origin of the information, some may be tied to the user’s workspace while others may be tied to the users account.
3. Summary Information – High level summary information based on selected Account/Portfolio/Watch List
4. Analysis Histogram and Historical Valuation Chart – displays a number of factor based measurements in a visual format across all securities based on user selection and configuration.
5. Pie Chart – Displays aggregate, group or security level detail in pie chart format.
6. Security Cards – Displays high level information relevant to an individual security.
7. Group Level Detail – Detailed data associated with group breakdowns as selected by user from the Title and Toolbar “Group By:” drop down control.
8. Security Level Detail – Detailed data associated with individual securities including holding or position data and valuation, real-time Connect, fundamental data and technical data along with relevant flags and user notes.
9. Totals Bar – Detailed aggregate data relevant to selected Account/Portfolio/Watch List and data points chosen in Security Level Detail section.
10. Security Quick View – detailed security level detail including price chart providing quick access to security specific data.
11. Currency Selector – Multi-currency portfolios can be normalized to a single currency for aggregate valuations within the Totals Bar.
12. Filter and Search – provides ability to filter out Accounts and Portfolios of which contain positions/holdings (i.e. actual ownership of the security) from Watch Lists (i.e. lists of securities where ownership is not necessary). Searching allows users to identify Accounts/Portfolios/Watch Lists which contain specified security or securities.