From the chart window context menu select Add | Add Forward Curve
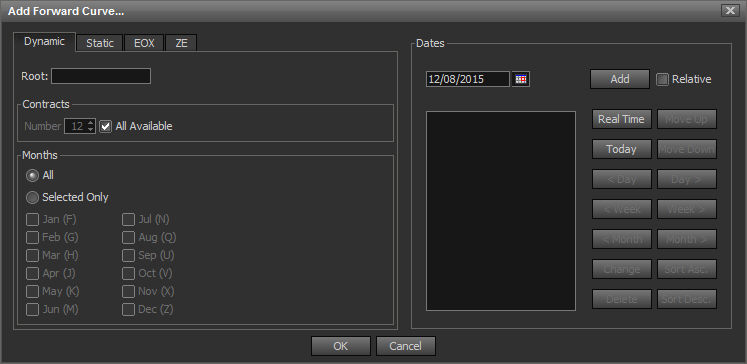
The Dynamic Tab is for creating Forward Curve plots that contain only active, non-expired contracts beginning with the front month. Dynamic Forward Curves saved within your workspace will Dynamically change over time as contracts expire, always using present days active contracts within the Curve.
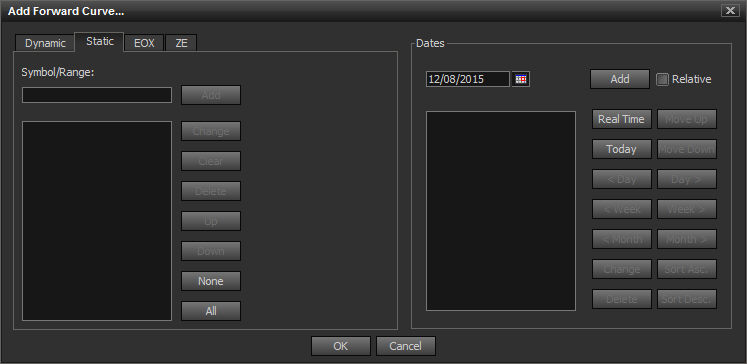
The Static Tab is for creating Historic Forward Curve plots and Forward Curve plots with fixed, Static contracts. The syntax for entering a range of contracts is *ROOT myyyy-myyyy. For example, *NG X2004-H2015
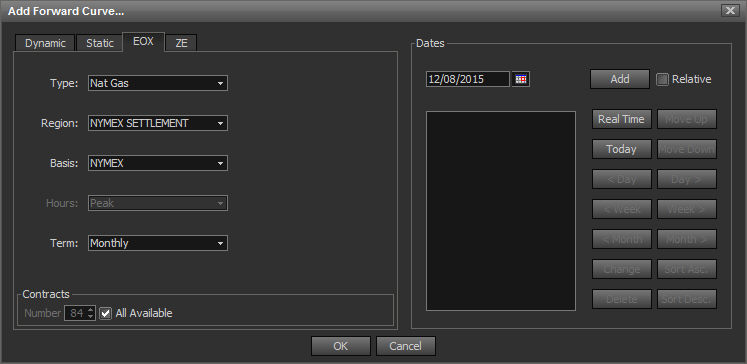
Natural Gas and Power Forward Curve data from EOX can now be displayed as a Fixed Chart Forward Curve, when entitled for EOX forward Curve data.
Note: After you have built out your EOX Forward Curve you can drag the chart header into a Watchlist and select how many points on the Curve to display.
|
Dynamic Tab |
|
|
Symbol Entry |
Description |
|
Root |
Input field for the commodities Root Symbol. Such as CL or NG |
|
Contracts |
Description |
|
Number |
Input field for number of contracts in the curve |
|
All Available |
When selected, all Forward Contracts are in the curve |
|
Months |
Description |
|
All |
All available contract months |
|
Selected Only |
Only use the selected months in the curve |
|
Static Tab |
|
|
Symbol Entry |
Description |
|
Symbol/Range |
Input symbol Range MonthYear to MonthYear with syntax: *ROOT myyyy-myyyy For example: CL Z2007-Z2015 or BRN-ICE Z2009-M2015 |
|
Add |
Select once a Symbol Range or Symbol has been entered |
|
Change |
Change a Selected Symbol |
|
Clear |
|
|
Delete |
Remove Selected Symbol from Curve |
|
Up |
Move Selected Symbols Up in list. Symbols are loaded in order listed. |
|
Down |
Move Selected Symbols Down in list. Symbols are loaded in order listed. |
|
None |
De-select all Symbols in list |
|
All |
Select all Symbols in list |
|
Dates |
A Curve will draw for each Date selected. |
|
Dates |
Description |
|
Date Picker |
Used to select a date for which to draw the curve |
|
Select to enter a Relative Date Curve. Relative Curves use a rolling displacement from the present date, instead of a static date. For example, a plot "2 days ago from the present date" or "3 weeks ago from the present date" |
|
|
Add |
Select once a date has been selected with the date picker |
|
Real Time |
Select to draw a real time curve |
|
Today |
Select to draw a curve with todays date |
|
< Day |
Add a curve that uses data from 1day less then selected date |
|
< Week |
Add a curve that uses data from 1 week less then selected date |
|
< Month |
Add a curve that uses data from 1 Month then selected date |
|
Day > |
Add a curve that uses data from 1 day ahead of selected date |
|
Week > |
Add a curve that uses data from 1 month ahead of selected date |
|
Month > |
Add a curve that uses data from 1 month ahead of selected date |
|
Change |
Change selected date |
|
Delete |
Delete selected date |
|
Sort Asc. |
Sort dates in ascending order |
|
Sort Desc. |
Sort dates in descending order |
|
Move Up |
Move selected date up in the list |
|
Move Down |
Move selected date down in the list |