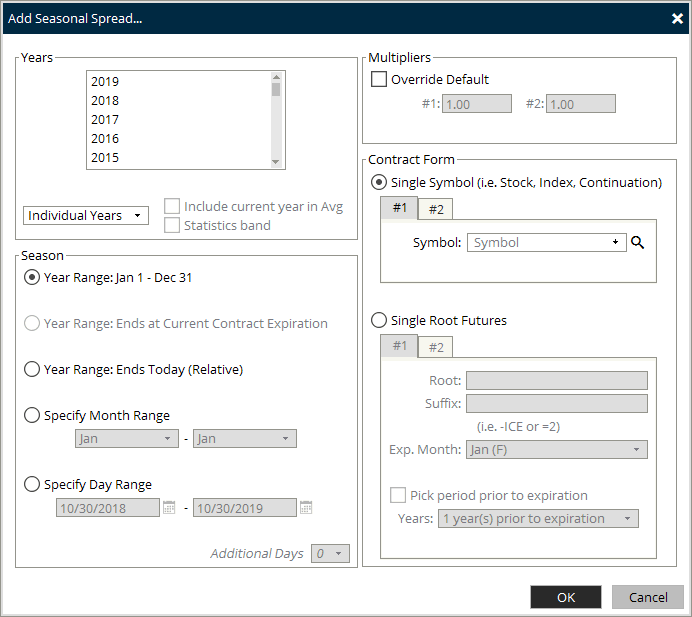
From the chart window context menu select Add | Add Seasonal Spread

|
Years |
Description |
|
Year |
Years to view chart history from |
|
Individual Years |
Only time series from the selected years will be displayed |
|
Statistics |
Only statistical overlays are plotted for selected years. Statistical overlays are 3 lines: |
|
Include current year in Avg |
When you include current year in your range, you can choose to optionally include those values in the average. This will only apply to average, not min or max. |
|
Statistics Band |
Display the statistics overlay as a band plot |
|
Both |
Individual years and statistics are displayed |
|
Contract Form |
Description |
|
Single Symbol |
Select to chart symbols such as indices, stocks, or futures continuation |
|
Symbol |
Two tabs, #1 and #2. Input field for symbols you wish to spread. Input 1st leg in #1 and second leg in #2 |
|
Futures Spread |
Select to spread futures contract. Use "Single Symbol" for Futures Continuation Symbol. Two Tabs, # 1 & # 2. Root, Suffix, Exp. Month, & Pick Period Prior to Exp must be independently entered for both Tabs # 1 & # 2. |
|
Root |
Input field for the futures root symbol |
|
Suffix |
Input field for futures symbols that contain a suffix at the end |
|
Contract Month |
Select the contract month for the futures |
|
Offset |
View history from the year prior to contract year for the symbol. Example: Offset of 1 year prior to expiration for M will use the M19 contract in 2018 instead of M18. |
|
Years |
The number of years to offset |
|
Season |
Description |
|
Year Range: Jan 1 - Dec 31 |
Season is Jan 1 thru Dec 31 |
|
Year Range: Ends at Current Contract Expiration |
Uses the Futures Contracts expiration date as the range end date. |
|
Year Range: Ends Today (Relative) |
Uses current day as the range end date |
|
Specify Month Range |
Specify a month range to chart. Month range may span Jan 1st, but is limited to 12 consecutive months |
|
Specify Day Range |
Specify a date range to chart. Day range may span Jan 1st, but is limited to 12 consecutive months |
|
Selected Only |
Only use the selected months in the curve |
|
Multipliers |
Description |
|
Override Default |
Select to override the default of 1.00 |
|
#1 |
Multiplier value applied to symbol 1 |
|
#2 |
Multiplier value applied to symbol 2 |