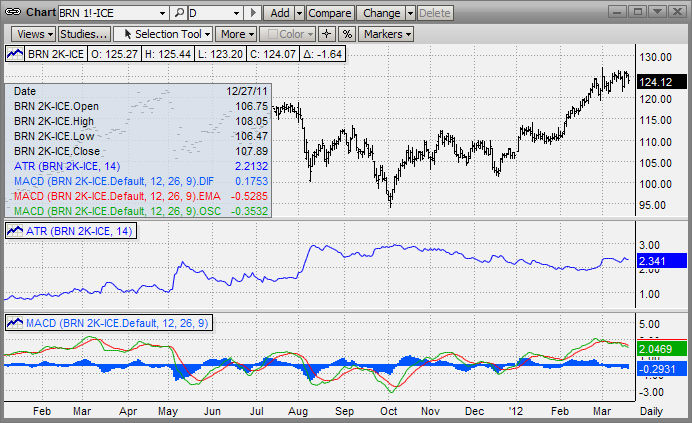
Interactive Charts Plus is a dynamic, highly sophisticated charting application with a full range of features not found in any other web site hosted on the Internet today. Utilizing advanced Java technology, Interactive Charts Plus uses streaming data with powerful tools that allow contract analysis customized to your exact specifications.

45 different technical studies, most with user-changeable study parameters
Easy creation of chartable expressions
User-changeable symbol and study colors
Powerful trendlines, such as Gann Fan, Fibonacci Fan, Fibonacci Retracement, and Speed Resistance Arc
Choice of Tick, Intraday, Daily, Weekly or Monthly time series
Data expressed in Bar, Line, Candlestick or Area format
Preferences can be saved on workspace charts to maintain symbol, aggregation, study, and chart type. This allows you to refresh or recall a chart that you have added to a workspace without losing chart settings.