Click the Studies button on the Chart toolbar, then select the appropriate study,
![]()
or right-click on the chart body and select the Studies option at the top.
A list of studies will then appear from which the desired study can be selected.
Descriptions for each chart study are now presented to the user from the Add Studies dialog box. When a study is selected on the left side, a short description of the study will be presented on the right side of the dialog box.
The Chart Studies dialog now supports drag and drop. You can now leave the Study dialog open and drag studies to the applicable chart pane. If multiple objects exist within a Chart Pane, you can drop the study on the applicable Symbol Header.
Note: You can change the properties for the study once it has been applied to the charts.
Adding Expression Shortcuts to Charts
The Add Studies window also has a tab to add Expressions Shortcuts.
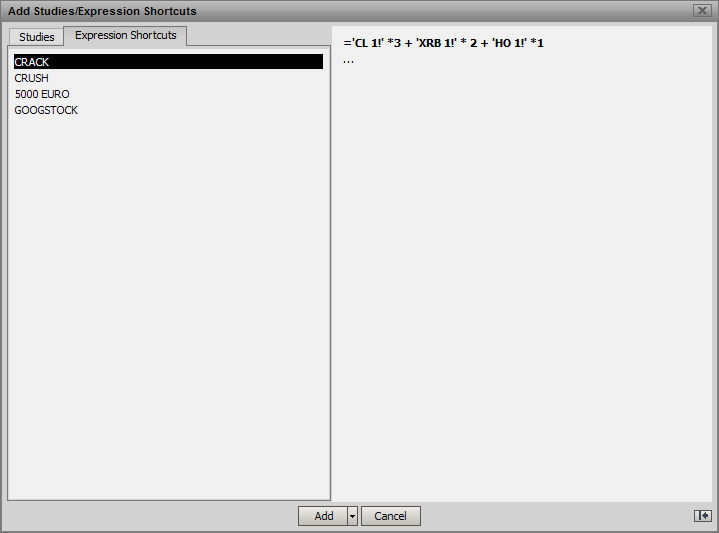
Highlight the desired Shortcut and use the Add button at the bottom of the window. See how to create Expression Shortcuts here