The Autoscale feature determines whether or not you have the ability to scroll, compress and expand the price scale on the chart.
Autoscale ON
When on, the charting application automatically changes the price scale to match the high and low prices currently in view on the chart. As you scroll the horizontal time scale, the price scale is automatically adjusted.
Autoscale OFF
When off, the charting application does not change the price scale to match the data in view on the chart. You are able to scroll the chart vertically by dragging the chart up and down.
Important! When Autoscale is off, you might notice that changing the contract on the chart appears not to display any data. This occurs when the new contract's price scale differs from the previous contract's price scale (the prices are actually on the chart, but not in view). To correct this, turn Autoscale on.
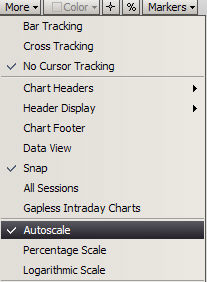
To turn Autoscale on or off, right click anywhere in the chart, then click Autoscale.
When checked, the feature is on.
Logarithmic scale can also be chosen to improve readability if the data covers a large range of data. The important thing to remember about logarithmic scale is that the intervals have different periods at different points on the scale, so it is important to read the indicator values.
In addition to the regular Price Scale, charts can display in percentage scale. Select the % button on the Chart toolbar or use the More pulldown.
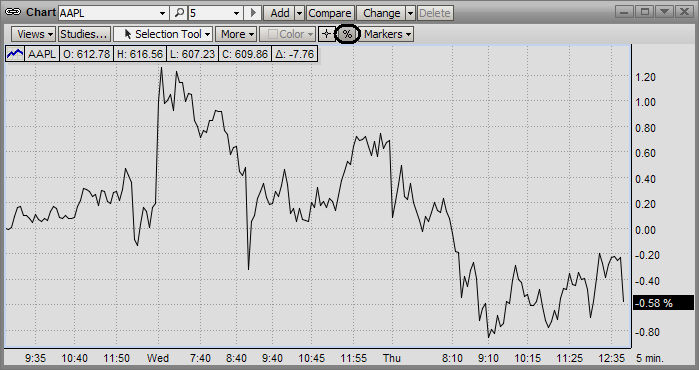
The percentage scale will appear on the right with the 0 line being placed at the price level at the far left side of the chart.
Click on the % button a second time to exit the Chart Percentage Scale and the Price Scale will reappear.