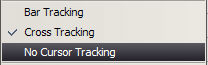
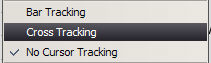
There are two types of cursor tracking options available. Cursor tracking is designed to identify which bar or tick corresponds to the price data that displays in the Data View window (if visible). Cursor tracking options are:
To turn cursor tracking off, click anywhere in the Chart and select No Cursor Tracking.
When done, save the workspace.
Bar Tracking refers to the vertical line that moves over the chart as you drag the mouse pointer.
Bar Tracking helps you identify which bar or tick in the chart corresponds to the price data that displays in the Data View window (if visible). The vertical bar shows the date of a trade or time increment in both the Data View window and on the time scale at the bottom of the chart. Moving the bar by one position in a chart shows the price values for each trade, while moving the vertical bar in a Daily chart shows the price values for each day.
Bar Tracking, by default, is turned on when a chart window is opened.
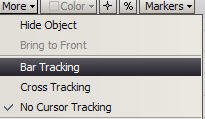
To turn Bar Tracking off, right click anywhere in the chart or on the More button on the toolbar. The chart options pop-up window appears. Select No Cursor Tracking.
When done, save the workspace.
Cross Tracking refers to the crossbar that moves over the chart as you drag the mouse pointer.
Cross Tracking helps you identify which bar or tick in the chart corresponds to the price data that displays in the Data View window (if visible).
The vertical bar of the cross shows the date of a trade or time increment in both the Data View window and on the time scale at the bottom of the chart. Moving the vertical bar by one position in a Tick chart shows the price values for each trade, while moving the vertical bar in a Daily chart shows the price values for each day.
The horizontal bar of the cross represents the price values. Moving the horizontal bar allows you to see the price in the price scale on the far right of the chart.
By default, Bar Tracking is turned on when a chart window is opened. To switch to Cross Tracking, right click anywhere in chart, then select Cross Tracking.
To turn Cross Tracking off, click anywhere in the chart, then select No Cursor Tracking.
When done, save the workspace.