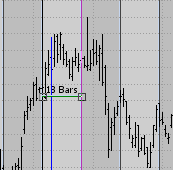
The Cycle tool allows the user to specify a period of bars and then strips the chart so that patterns can be discerned

The control Bars are used to set the width (period) of the cycle. There is a display above the control line that indicates how many bars are in a period.
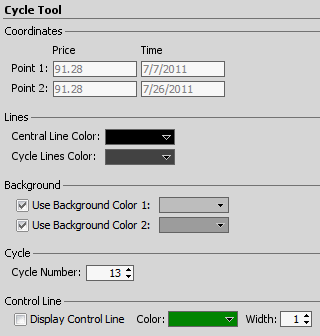
Cycle Tool properties can be accessed by clicking on the control bars or lines, right-clicking and selecting Object Properties.

|
Property |
Description |
|
Coordinates |
Prices and Dates for the 2 endpoints. Prices will be the same for both as the control line is flat. |
|
Central Line Color |
The Central Line is the line created at the chart location first clicked on by the drawing tool |
|
Cycle Line Color |
The Cycle Lines are all of the other periodic lines showing the cycle |
|
Background Colors |
Can select 1 or 2 (alternating) background colors, or none (lines only) |
|
Cycle Number |
number of bars or ticks in a cycle period |
|
Control Line Display |
Checkmark to display the Control Line on the chart. |
|
Control Line Color |
Select the Color for the Control Line |
|
Control Line Width |
Choose a width for the line, between 1 - 10. |