Many of the characteristics that make up the look and feel of the window are customizable using the Display Properties window.
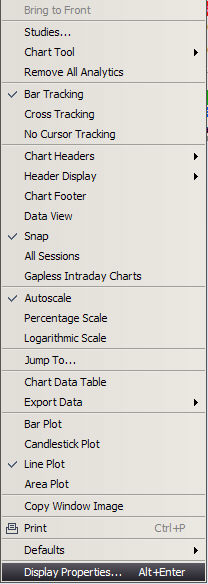
To access Display Properties, right click in the Chart.
Click the Display Properties option. A pop-up window displays.
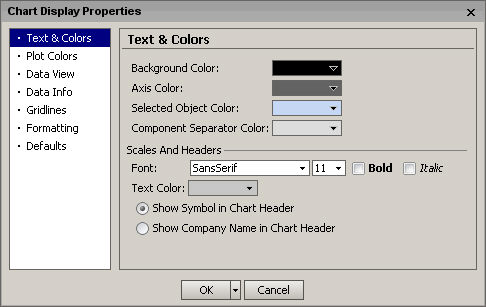
COLORS
To set the background color of the entire Chart, go to the Color section and click on the Background Color drop down list. Select the color.
To set the axis color ( the color of the axis line above the time descriptions and to the left of the price axis numbers), use the Axis drop down list. Select a color. To set the color of the selected object, click on the color drop down box in the Selected Object Color field. To change the color of the line that separates the chart and a study, click on the color drop down box in the Component Separator Color field.
SCALES AND HEADERS
To change the text font, go to the Scales And Headers section,
click on the Font drop down box. Select the font. To change the size of the text, click in the drop down list next to the Font field.
Select a font size. To redefine the font style, put a check the Bold check box or the Italic check box, or both. To change the text color, click in the Text Color drop down list. Select the color. To determine whether the Symbol or the Company Name will appear in the Chart Header click the appropriate button.
PLOT COLORS
To change the color of the plot and the display view, go to the Plot Color section of the window.
Click the Plot Color drop down list. Select a color. When you use area plot tools, you can change the color of the area below the plot line, by clicking the drop down list in the Area Color field and selecting the color. To change the color of a tick that is the same as the last tick, click on the drop down list in the Tick Trade Color. To change the color of the bid ticks, select a color in the drop down list in the Tick Bid Color field. To change the color of the ask ticks, select a color on the drop down list in the Tick Ask Color field. Ticks are viewable on tick charts only, not in studies or tools.
Change the color of the a filled candlestick by clicking on the drop down list in Filled Candlestick Color. To change the color of the a hollow candlestick, click in the drop down list in Hollow Candlestick Color. Select a color. To set the outline color of a filled candlestick, click the drop down list in the Filled Candlestick Outline field. Select a color. To set the outline color of a hollow candlestick, click the drop down list in the Hollow Candlestick Outline field. Select a color.
To change the font used by data view, go to the Data View section, and click the drop down list in the Font field.
Select a font. To change the text size, click the drop down list next to the Font field. Select the font size. Change the font style by clicking in either the Bold or Italic check box.
To choose whether the view will be Line or Box select from the Type pulldown:
To show titles click on the checkbox shown above.
The background color and it's transparency % can be selected from the appropriate menu items below.
Change the text color by clicking in the drop down list in the Text color field.
Change the border color by clicking in the drop down list in the Border color field.
Change the crosshair color by clicking in the drop down list in the Crosshairs color field.
DATA INFO
Indicators can be formatted using the Data Info window.
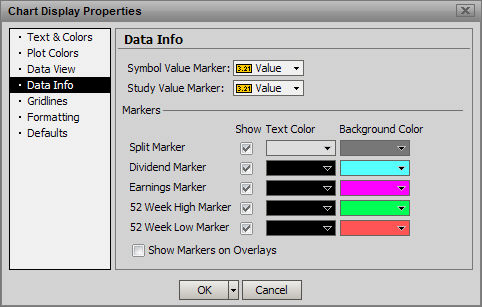
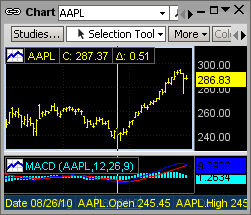
Symbol and Study Value Markers can be set to either show a Value or an Arrow marker or None:
The Arrow Marker can be seen at the right side of this chart
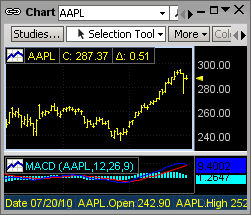
Value Marker:
Split Markers can be turned on and off. When the split marker is moused over, the split date and ratio appear as a tooltip:
Split Markers text and background colors can be changed.
GRIDLINES
You can show the horizontal gridlines by clicking on the check box in the Show Horizontal Gridlines field.
You can show the vertical gridlines by clicking on the check box in the Show Vertical Gridlines field. Change the color of the gridlines, by clicking on the drop down list in the Grid Color field and selecting a color.
You can now choose different grid line styles for the Chart display.
FORMATTING
Clicking on the check box in the Show Full Precision field expands the precision of the Volume field showing the complete number over an abbreviated display (for instance, 645m instead of 645,000,000)
DEFAULTS
Select the default Styles and other parameters that will affect all subsequently generated charts:
Plot Style
Expression Plot Style
Add Option
Determines whether an added chart will default to New Pane, Overlay or part of the Existing Scale
Up/Down Color based on previous close
![]()
Otherwise the color will be based on the movement from the first to the second transaction of the open session.
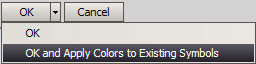
After making changes to Chart properties color changes will be applied only to new charts by selecting OK. In order to apply color changes to existing charts select OK and Apply Colors to Existing Symbols.