To set object properties you must have a tool on a study.
To access the Object Properties option, click on the study to highlight it. Right click on the study.
![]()
The options window displays. Click on Object Properties. The Chart Objects Properties window appears:
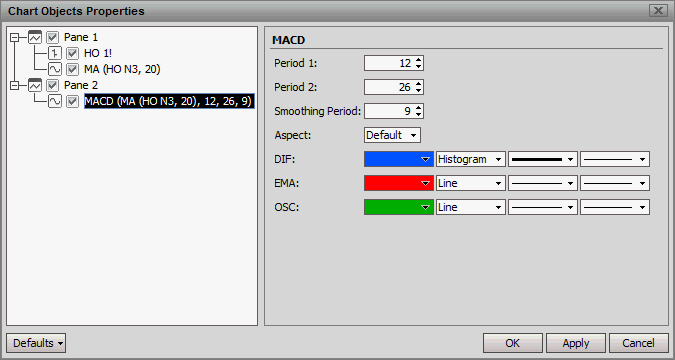
The Charts Object Properties allows Symbols, Panes and Studies to be hidden and displayed by using the checkmarks. Highlighting on a study displays the study parameters for editing.
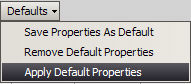
Once changes have been made to a study they can be saved as a new default
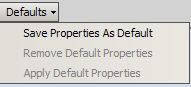
When accessing existing charts the new Default can be applied or removed