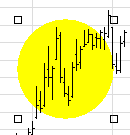
The ellipse is a non-analytical drawing object used to highlight or bring attention to a group of bars or a particular section in a chart.
When an ellipse is drawn, four "grab bars" are placed around the object. To resize the ellipse, click on the object to select it, position the cursor on any of the grab bars, and drag it to the desired size.

To move the ellipse, position the cursor in its center (the cursor changes to a hand). You can now drag it to a new position on the chart.

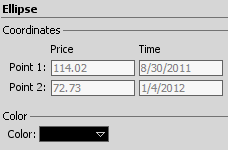
The ellipse has only one property; color. To access the property, right click inside the ellipse and select Object Properties.

Click in the Color box to choose a color from the drop-down list. Click Apply. Click OK.