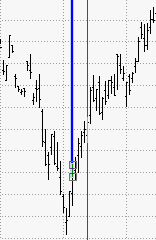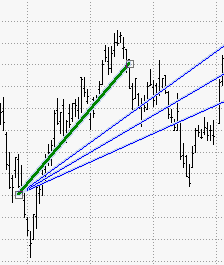
Fibonacci Fan is displayed by drawing a trendline between two reference or extreme points on the chart (usually a trough and opposing peak). Next, an invisible vertical line is drawn through the second reference point. Three trendlines are then drawn from the first extreme point so they pass through the invisible vertical line at the Fibonacci levels of 38.2%, 50.0%, and 61.8%.
Fibonacci Fan lines use Fibonacci percentages to divide a time-price range defined by two reference points.
The first reference point defines the starting-limit-price-and-time and is the point from which the fan extends. The time-price range is determined relative to a second point that defines the ending-limit-price-and-time. The intermediate angles of the fan conform to the Fibonacci percentages.
When the fan is drawn, two "grab bars" are placed where the control line starts and ends. The control line is thicker than the fan lines and is green by default.

To change the position of the control line, click on the object to select it, position the cursor on either of the grab bars, and drag it to the desired location. This will change the angle of the fan in relation to the starting point.

To move the Fibonacci Fan, position the cursor in its center (the cursor changes to a hand). You can now drag it to a new position on the chart.
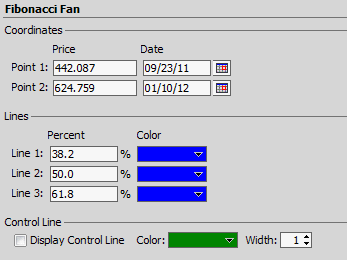
You can change several Fibonacci fan properties. To access properties, select the line and right click on the tool. The Properties pop-up window displays.

|
Property |
Description |
|
Coordinates: Point 1 is where the Ficonacci Fan is initiated by the drawing tool. Point 2 is the point on the control line where drawing was stopped -changing this point will affect all other lines proportionally. |
|
|
Beginning Price |
The price value on which the fan is currently positioned. |
|
Beginning Time |
The time value on which the fan is currently positioned. |
|
Up to three lines can be displayed for a Fibonacci Fan. For each line, you can set these properties:
|
|
|
Angle |
The Fan angle percentage of the angle between the Control line and the horizon line (level) |
|
Color |
The color of the line. Click the Color box to choose a color from the drop-down list. |
|
Width |
The width of the fan line, between 1 - 10. |
|
Line 1 is the first line's percentage of the angle difference between the control line and the x-axis (default is 38.2%). Line 2 is the second line's percentage of the angle difference between the control line and the x-axis (default is 50.0%). Line 3 is the third line's percentage of the angle difference between the control line and the x-axis (default is 61.8%). |
|
|
Display Control Line |
Put a checkmark in the Display Control Line box to display the control line on the chart. |
|
Color |
The color of the line. Click the Color box to choose a color from the drop-down list. |
Click Apply. Click OK. When done, save the workspace.