Lines are used to mark the trends in which markets are moving.
When a line is drawn, two "grab bars" are placed around the object. To resize the line, click on the object to select it, position the cursor on any of the grab bars and drag it to the desired size.
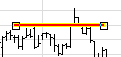
To move the line, position the cursor in its center (the cursor changes to a hand). You can now drag it to a new position on the chart.
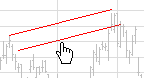
It is also possible to create parallel lines by holding the CTRL key down, selecting the line and then dragging it to a new position on the chart.
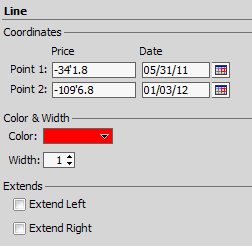
You can change several line properties. To access the properties, right click on the highlighted tool and select Object Properties and highlight the Line Selection tool.
|
Property |
Description |
|
Coordinates |
Select Prices and Dates to set the 2 endpoints. |
|
Color |
Click the Color box to choose a color from the drop-down list. |
|
Width |
Choose a width for the line, between 1 - 10. |
|
Extend Left |
When checked, the line extends indefinitely to the left. |
|
Extend Right |
When checked, the line extends indefinitely to the right. |
When done, click Apply. Click OK.