Fibonacci Retracements are displayed by drawing a trendline between two reference or extreme points on the chart (usually a trough and opposing peak). Next, a series of nine horizontal lines are drawn. The lines intersect the trendline between the two reference points at the Fibonacci levels of 0.0%, 23.6%, 38.2%, 50.0%, 61.8%, 100.0%, 161.8%, 261.8%, and 4236%. Some of the lines might not be visible, because of the scale limitations in the chart window.
When a price increases or decreases significantly, it often retraces a significant portion. During retracements, support and resistance levels can be defined at or near the Fibonacci Retracement levels.
After a significant price move (either up or down), prices often retrace a significant portion - if not all - of the original move. As prices retrace, support and resistance levels often occur at or near the Fibonacci Retracement levels.
When the lines are drawn, two "grab bars" are placed where the control line starts and ends. To change the position of the control line, click on the object to select it, position the cursor on either of the grab bars, and drag it to the desired location.
To move the Fibonacci Retracements, position the cursor in its center (the cursor changes to a hand). You can now drag it to a new position on the chart.
You can change several elements of the Fibonacci replacement tool, through the use of properties. To access the tool properties, double click on the highlighted tool.
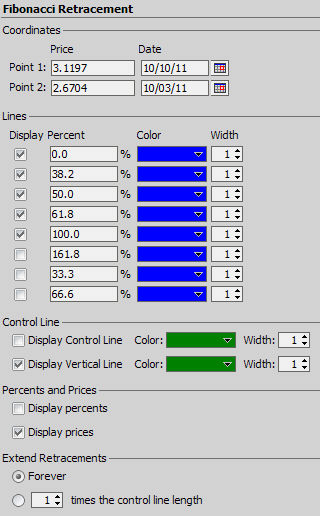
Change the following:
|
Property |
Description |
|
Up to eight lines can be displayed for Fibonacci Retracements. For each line, you can set these properties: |
|
|
Display |
Check this box to display this line. |
|
Percent |
The intersection point with the control line. |
|
Color |
The color of the line. Click the Color Box to choose a color from the drop-down list. |
|
Width |
The width of the line, between 1 - 10. |
|
Control line properties: |
|
|
Display Control Line |
Check this box to display the control line. |
|
Control line color |
The color of the control line. Click the Color Box to choose a color from the drop-down list. |
|
Width |
The width of the control line, between 1 - 10. |
|
Vertical line properties: |
|
|
Display vertical line |
Check this box to display this line. |
|
Color |
The color of the vertical line. Click the Color Box to choose a color from the drop-down list. |
|
Width |
The width of the vertical line, between 1 - 10. |
|
Display properties: |
|
|
Display percents |
Check this box to display the percent at which this line intersects the control line. |
|
Display prices |
Check this box to display the price at which this line intersects the control line. |
|
Extend retracements properties (check ONE): |
|
|
Forever |
Choose this option to extend the retracement lines forever. |
|
'n' times the control line length |
Choose this option, and enter a number between 1- 100. The retracements are extended 'n' times the length of the control line. |