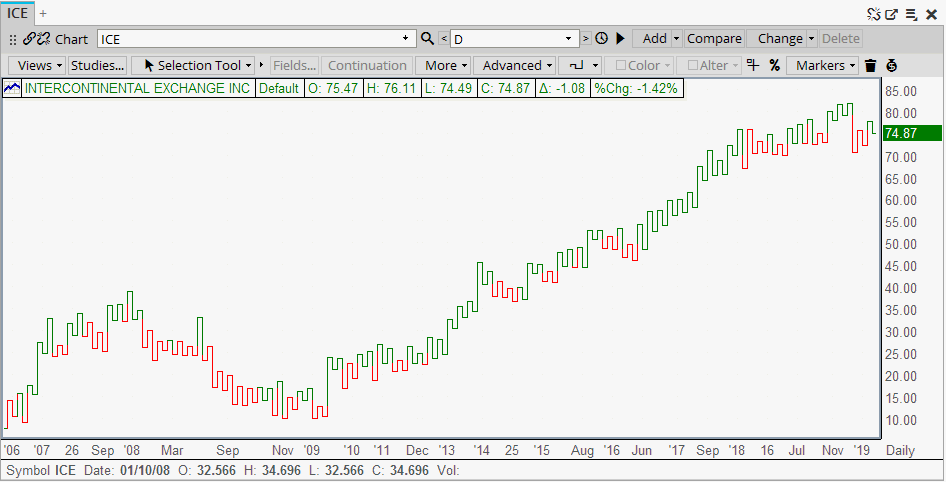
Kagi charts display a series of connecting vertical lines where the thickness and direction of the lines are dependent on the price action. A new vertical line is drawn, whenever the specified reversal amount is achieved and the time interval closes. The charts ignore the passage of time. If prices continue to move in the same direction, the vertical line is extended. However, if prices reverse by a "reversal" amount, a new kagi line is then drawn in a new column. When prices penetrate a previous high or low, the thickness of the kagi line changes. A projection is drawn with real-time data to show where the next Kagi line will be drawn. There is also a small horizontal reversal line showing where the price has to go for a reversal to happen.
