The Data View window dynamically displays information on the prices and applied studies for the intersection at which the mouse pointer is placed on a chart. You can use one of the cursor tracking options to aid in identifying which bar or tick in the chart corresponds to the Data View's time increment.
The Data View window can be positioned anywhere on the chart. To move the Data View, simply drag it to a new location.
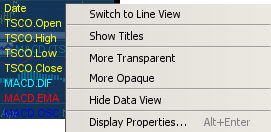
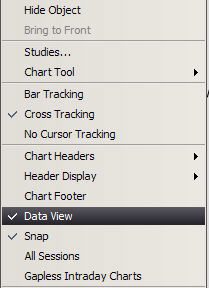
The Data View can be displayed as a box of data or a line of data. By default, the data is found in a box. To change the presentation to a line, right click in the Data View box, and click Switch to Line View.
The Line View appears at the bottom left of the chart by default:
Show Titles
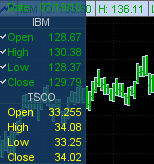
You can now choose a different display mode for the Data View Window. This new mode will separate each Symbol with a Title Row. This is done by selecting Show Titles from the Data
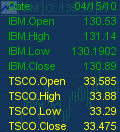 which changes the data view to
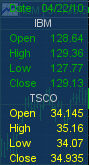
Active Symbol Indicator
When there are multiple overlays, a check mark will appear next to the active symbol.
View Context Menu.
The colors of the Data View window correspond to the colors of the symbol and studies applied to the chart. When the color of the symbol or study is changed, the color of the Data View window also changes.
By default, the Data View is visible when a chart window is opened. To turn the Data View window off, click anywhere on the chart, then uncheck the Data View box.
To make the Data View window easier to see through, right click in the Data View box, and click the More Transparent option.

To make the Data View window harder to see through, right click in the Data View box, and click the More Opaque option.
To hide the Data View window, right click in the Data View box, and click the Hide Data View option.
Data View Display Properties
can be found HERE