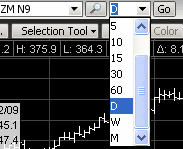
The Chart toolbar contains a drop down list that controls the time series. The button name is always set to the type of time series currently displayed on the chart. For example, when the chart is a daily chart, the button is named "D."

To change the chart time series, click the time series drop-down menu and choose the appropriate setting, such as Tick, 5, 10, D, W, or M).
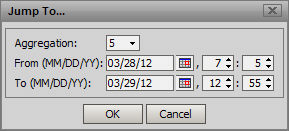
You can now specify Start and End Times and have the chart dynamically scale. This is done by the Jump To Dialog from the Context Menu.
![]()
You can also access this feature by pressing Ctrl + clicking the time scale.
