You can enter Expressions and studies in the chart that contain references to existing plots within the chart window. These plots can be symbols or expressions.
When using reference you will refer to each plot by a number, in the order in which it is placed on the chart, as well as the pane in which it exists.
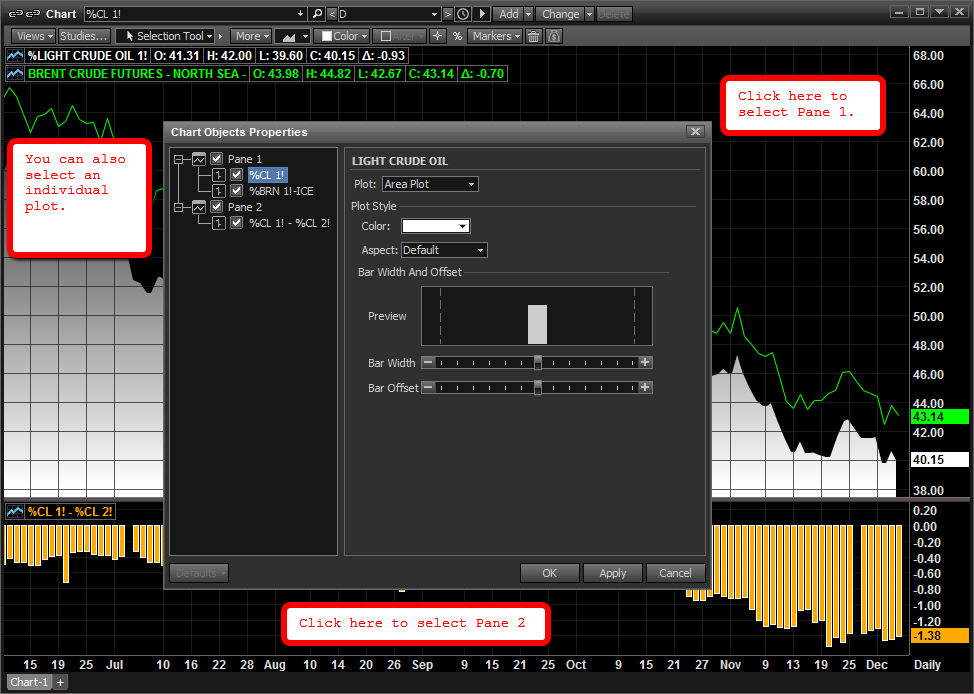
Before you start a new expression that contains a reference, you must first tell the chart which part of the chart you are referencing. Your choices are a single plot, or a pane within the chart. Once you select a area of the chart you will reference, the plot numbers begin.
In the example above:
If you click Pane 1: Light Crude is #1, Brent Crude is #2
If you click Pane 2: Expression of %CL 1!-%Cl 2! is #1
If you click just the plot in pane 1 of Brent Crude: Brent Crude is #1
Example Usage:
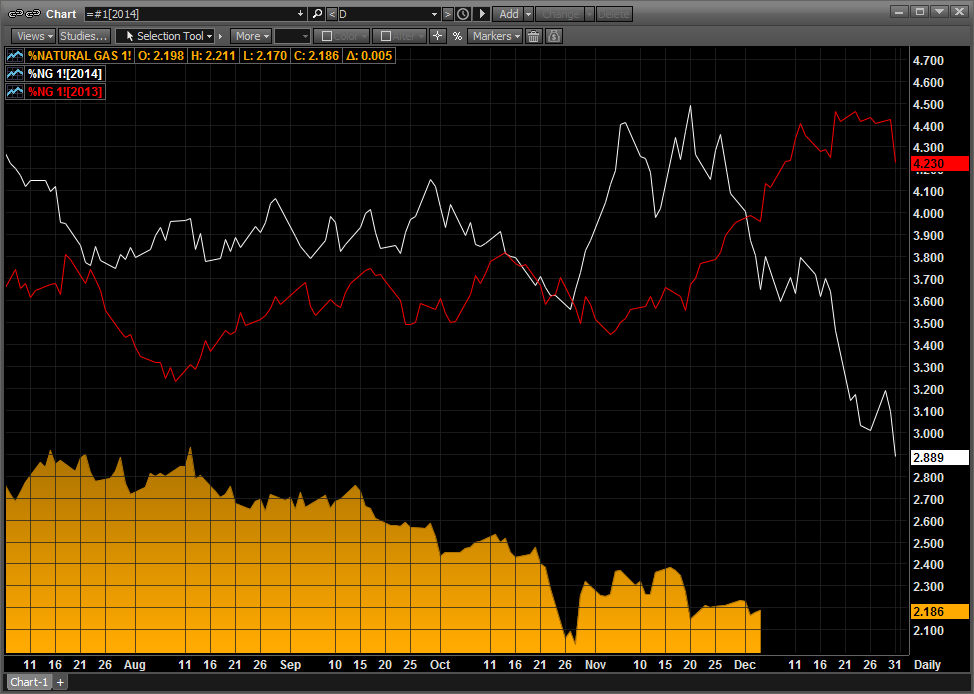
In the above example, I added the seasonal plots for 2014 and 2013, and had them reference the main symbol. This way I only have to change the main symbol and I will still have a seasonal view of the new symbol.