To perform a Risk Analysis for a position, click the Analyze Button on the toolbar.
(The position pane must contain a position, i.e at least one cell in the Qty column must be nonzero)
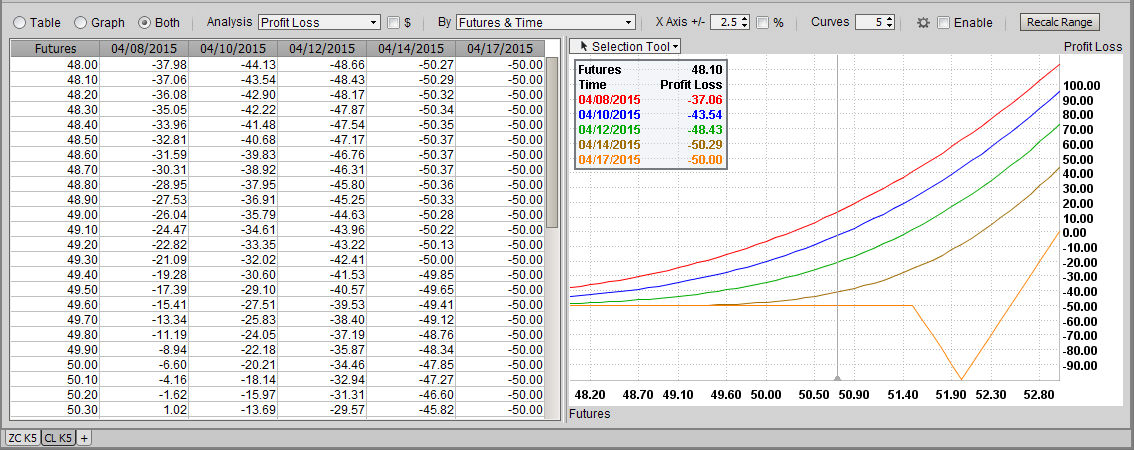
The Risk Analysis, Table, and Chart will appear. The Risk Analysis pane has controls that are used to change the results in the Table and Graph.
The Analysis Drop Down determines which analysis is displayed on the y-axis.
Analysis Options are:
The By Drop Down determines which risk factor is displayed on the x-axis as well as which risk factor is displayed on the Contours (curves).
By Options are:
The X Axis +/- setting will allow you to specify the range for the X Axis and the table. It can be specified in points or percentage from the ATM Price.
The Curves setting will allow you to specify how many curves you want the time range to display.
User Defined Analytic Configuration
The setup of the table can run via a Algorithm based on market conditions or it can be manually configured by using the Analytic Configuration

Users can manually configuration the X Axis and Contour and enable and disable it on the fly.
If you want to reset your table based on current market conditions you can use the Recalc Range button