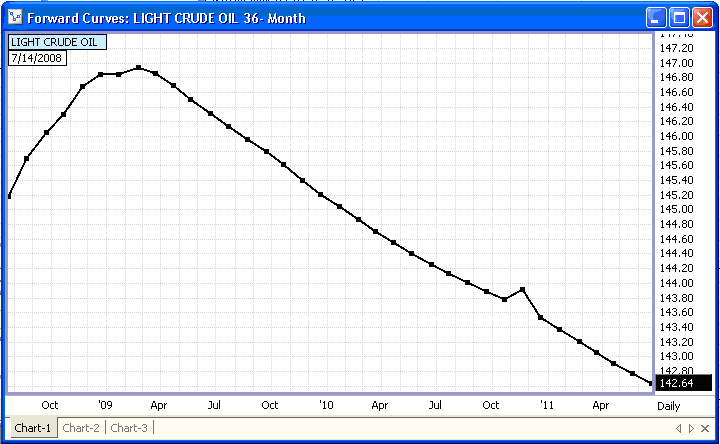
A Forward Curve chart allows you to chart a set of Futures Contract Prices with different expirations, on a specific date for a given commodity.

In the example above we are viewing a Forward Curve of Crude, 36 months out. The curve is using data from 7/14.