About Seasonal Charts
A Seasonal Chart Allows you to look at Seasonal Tendencies of a Market in order to better gauge what direction a futures market typically moves under typical prevailing forces over a certain time frame. You have the ability to overlay data for a particular symbol(s) for particular years and Month Ranges (Seasons).
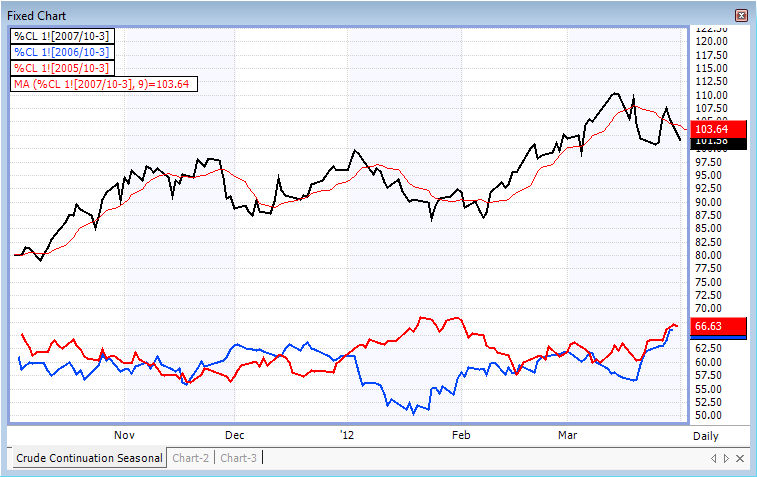
In the example above we are viewing a Seasonal Chart of Crude’s Continuation contract over 3 past years during the Season of October thru March. There is also a Moving Average applied to the 2007 plot.
Seasonal Charts can be viewed in Fixed Chart and Chart window types.