Change Chart Symbol Color

You may change the chart symbol color using the Color tool in the Chart toolbar. When using a Bar or Candlestick plot, you may also identify up and down colors by displaying the Plot Properties.


To change the color using the toolbar


  1. Click once on the symbol, or click once on the symbol header to select it.
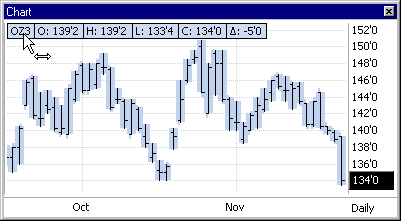


  2. Use the Color tool in the Chart toolbar to change the color.

    OR
     

  1. Right-click on the symbol to display the context menu.
     

  2. Select Change Color, then choose a color from the menu displayed.


To change the color using the Plot Properties Dialog Box (Bar and Candlestick Plots only)


  1. Double-click on the symbol, or double-click on the symbol header.

    Result
    : The Plot Properties dialog box displays.
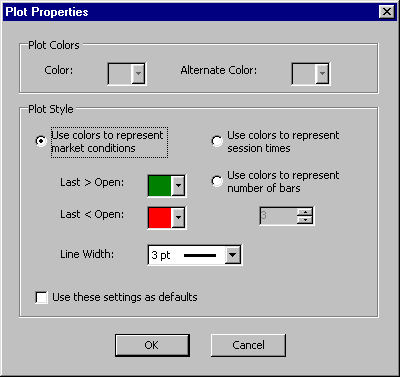


  1. Make the following decision:


    To ...

    Then  ...

    use one color, or a pair of alternating colors to identify session times

    click the field called Use colors to represent session times, then select the appropriate Color and Alternate Color at the top of the dialog box.


    Note: By choosing the same color in the Color and Alternate Color fields, the chart symbol will display using one color.


    Use of an alternate color will differentiate different things, based on the chart aggregation:

    Tick
    - not applicable

    Intraday - identifies when trading sessions change

    Daily - identifies months

    Weekly - identifies years

    Monthly - identifies years


    use one color, or a pair of alternating colors to identify a number of bars

    click the field called Use colors to represent number of bars, select the number of bars, then select the appropriate Color and Alternate Color at the top of the dialog box.


    Note: By choosing the same color in the Color and Alternate Color fields, the chart symbol will display using one color.


    This option is not applicable on a Tick chart.
     

    show up and down movement using different colors

    click the field called Use colors to represent market conditions, then select colors for the Last > Open and Last < Open fields.


    Using different colors to identify up and down movement can help you quickly identify market movement, as shown below:


  1. To use these settings for all future charts you will create, check the field called Use these settings as defaults.
     

  2. Click OK to save your changes.