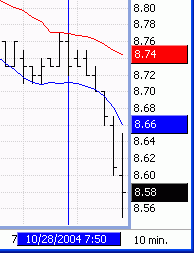
The Vertical Line tool allows you to draw a vertical line on the chart, and displays the corresponding date and time (in the case of Intraday or Tick charts) on the Time scale.

Add a Vertical Line to a chart
From the Chart Tools toolbar, click on the Vertical Line tool. ![]()
Click anywhere on the chart to add the Vertical Line.
To deactivate the Vertical Line
From the Chart Tools toolbar, click on the Select Arrow ![]() or hit the ESC key.
or hit the ESC key.