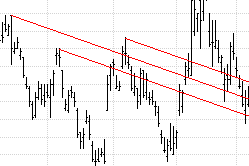
Andrew's Pitchfork

Andrew's Pitchfork lines build a channel that looks like a pitchfork, using three reference points. A pitchfork image arises because each line is extending to the right from its reference point.


The first reference point belongs to the "median line" of the channel. The other two points define the outer limits of the channel. The slope of the channel/pitchfork is defined as the slope of the line through the first reference point that divides in two the imaginary line between the second and third reference points.


The interpretation of the pitchfork is based on support and resistance level principles.


Properties: None


Add Andrews Pitchfork to a chart


  1. From the Chart Tools toolbar, click on the Andrews Pitchfork tool.
     

  2. Click on the chart three times to define the tool's reference points.
    Result
    : After clicking the third time, the tool is drawn.
     

  3. You may continue to add this tool to the chart by repeating Steps 1-2. To de-select the tool, click on the Selection arrow from the Chart Tools toolbar , or hit the ESC key.


Change the position of a control line


  1. When the pitchfork is drawn, a "grab bar" is placed where each control line starts. To change the position of a control line, click on the object to select it.
     

  2. Position the cursor on the grab bar, and drag it to the desired location by holding down your left-mouse button.
     

  3. Once done, de-select the tool by clicking anywhere on the chart.