
|
Property |
Description |
|
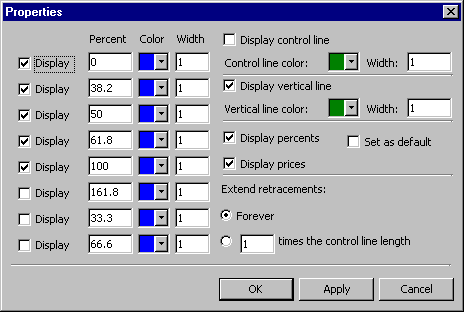
Up to eight lines may be displayed for Fibonacci Retracements. For each line, you may set these properties: |
|
|
Display |
Check this box to display this line. |
|
Percent |
The intersection point with the control line. |
|
Color |
The color of the line. Click the Color Box to choose a color from the drop-down list. |
|
Width |
The width of the line, in pixels. |
|
Control line properties: |
|
|
Display Control Line |
Check this box to display the control line. |
|
Control line color |
The color of the control line. Click the Color Box to choose a color from the drop-down list. |
|
Width |
The width of the control line, in pixels. |
|
Vertical line properties: |
|
|
Display vertical line |
Check this box to display this line. |
|
Color |
The color of the vertical line. Click the Color Box to choose a color from the drop-down list. |
|
Width |
The width of the control line, in pixels. |
|
Display properties: |
|
|
Display percents |
Check this box to display the percent at which this line intersects the control line. |
|
Display prices |
Check this box to display the price at which this line intersects the control line. |
|
Set as default |
When checked, the properties displayed will be used every time a Fibonacci Retracement is added to a chart. |
|
Extend retracements properties (check ONE): |
|
|
Forever |
Choose this option to extend the retracement lines forever. |
|
'n' times the control line length |
Choose this option, and enter a number. The retracements will be extended 'n' times the length of the control line. |