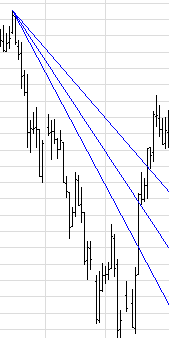
Fibonacci Fan

Fibonacci Fan is displayed by drawing a trendline between two reference or extreme points on the chart (usually a trough and opposing peak). Next, an invisible vertical line is drawn through the second reference point. Three trendlines are then drawn from the first extreme point so they pass through the invisible vertical line at the Fibonacci levels of 38.2%, 50.0%, and 61.8%.


Fibonacci Fan lines use Fibonacci percentages to divide a time-price range defined by two reference points.


The first reference point defines the starting-limit-price-and-time and is the point from which the fan extends. The time-price range is determined relative to a second point that defines the ending-limit-price-and-time. The intermediate angles of the fan conform to the Fibonacci percentages.


Properties: Double-click on the tool to display its properties.


Add Fibonacci Fan to a chart


  1. From the Chart Tools toolbar, click on the Fibonacci Fan tool.
     

  2. Holding the left-mouse button, click on the chart where you want to start the control line, then drag the mouse to where you want to end the control line and release the mouse button.
    Result
    : The tool is drawn.
     

  3. You may continue to add this tool to the chart by repeating Steps 1-2. To de-select the tool, click on the Selection arrow from the Chart Tools toolbar , or hit the ESC key.


Change the position of the control line


  1. When the fan is drawn, a "grab bar" is placed where the control line starts. To change the position of the control line, click on the object to select it.
     

  2. Position the cursor on the grab bar, and drag it to the desired location by holding down your left-mouse button.
     

  3. Once done, de-select the tool by clicking anywhere on the chart.