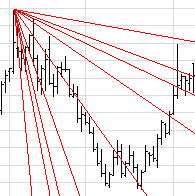
Gann Fan

A Gann Fan is drawn between a significant bottom and top (or vice versa) at various angles.


For a Gann fan, two reference points define the middle line of a nine-line "fan" of time relative to price. The first reference point is the one from which the fan extends. The second reference point, drawn to the right of the first, determines the rate of equivalence between time and price. The angles of the fan, relative to an assumed horizontal line and middle line's angle, are shown in the table value.


In Gann's original formulation, the rate of equivalence between time and price was 1/1 (one unit of time equals one unit of price), so that the middle line of the fan defines a 45º angle.


Since the rate can be m/n (m units of time equals n units of price), angles relative to the middle line's angle are adjusted accordingly. For example, the actual ratio of the 1-to-8 line is 1-to-(8*n/m).


Properties: Double-click on the tool to display its properties.


The table below displays the calculations involved in the Gann Fan.


Time x Price

Fan angle (degrees) via 45º middle line

1 x 8

82.5

1 x 4

75.00

1 x 3

71.25

1 x 2

63.75

1 x 1

45.00

2 x 1

26.25

3 x 1

18.75

4 x 1

15.00

8 x 1

7.5


Add Gann Fan to a chart

  1. From the Chart Tools toolbar, click on the Gann Fan tool.
     

  2. Holding the left-mouse button, click on the chart where you want to start the control line, then drag the mouse to where you want to end the control line and release the mouse button.
    Result
    : The tool is drawn.
     

  3. You may continue to add this tool to the chart by repeating Steps 1-2. To de-select the tool, click on the Selection arrow from the Chart Tools toolbar , or hit the ESC key.


Change the position of the control line


  1. When the tool is drawn, a "grab bar" is placed where the control line starts. To change the position of the control line, click on the object to select it.
     

  2. Position the cursor on the grab bar, and drag it to the desired location by holding down your left-mouse button.
     

  3. Once done, de-select the tool by clicking anywhere on the chart.