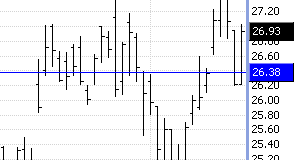
A Level Line is used to mark a price point on the chart. The level line will extend the entire horizontal distance on the chart.
Properties: None
|
|
A Level Line is used to mark a price point on the chart. The level line will extend the entire horizontal distance on the chart.
Properties: None |
Add a level line to a chart
From the Chart Tools toolbar, click on the Level Line tool. ![]()
Click ONCE on the chart where you want to place the line.
Result: The tool is drawn.
You may continue to add this tool to the chart by repeating Step 2. To de-select the tool, click on the Selection arrow from the Chart Tools toolbar ![]() , or hit the ESC key.
, or hit the ESC key.
Change the position of the line
To change the position of the level line, click on the object to select it.
Drag it to the desired location by holding down your left-mouse button. Release the mouse button to drop the line into its new position.
Once done, de-select the tool by clicking anywhere on the chart.