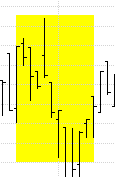
The rectangle is a non-analytical drawing object used to highlight or bring attention to a group of bars or a particular section in a chart.
Properties: None
|
|
The rectangle is a non-analytical drawing object used to highlight or bring attention to a group of bars or a particular section in a chart.
Properties: None
|
Add a Rectangle to a chart
From the Chart Tools toolbar, click on the Rectangle tool. ![]()
Holding the left-mouse button, click on the chart where you want to start drawing the rectangle, then drag the cursor to draw the tool. Release the mouse when done.
Result: The rectangle is drawn.
You may continue to add this tool to the chart by repeating Steps 1-2. To de-select the tool, click on the Selection arrow from the Chart Tools toolbar ![]() , or hit the ESC key.
, or hit the ESC key.
Resize the ellipse
When a rectangle is drawn, "grab bars" are placed around the object. To resize the rectangle, click on the object to select it.
Position the cursor on any of the grab bars, and drag it to the desired size by holding down the left-mouse button.
Once done, de-select the tool by clicking anywhere on the chart.