You may change the InputField for a study with multiple Plot Names as well as the study parameters, in the syntax as the following examples show:
When adding a study to a quote that has multiple plot names, you must specify the name of the plot along with the syntax:
Aggregation:function (source.InputField, value, value, value).PlotName
You can find Plot Names for studies on the Function Names list. Please note that you cannot drag and drop a study that contains multiple plot lines from a chart to the quote or data table.
To view a multiple-plot study on a price page, you will need to add syntax for all plots. For example, to add the Variable Moving Average (VMA) to a quote, you will have to enter three separate lines of syntax.
=D:VMA ('IN A0').PLOT1
=D:VMA ('IN A0').PLOT2
=D:VMA ('IN A0').PLOT3
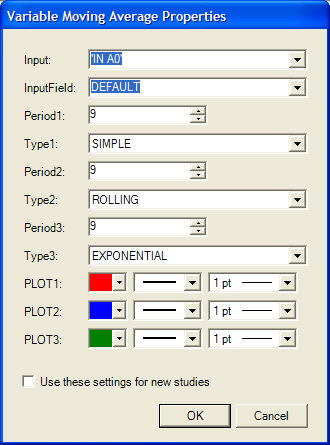
Some studies that having multiple plots, such as the Variable Moving Average, have multiple study parameters as well. Here are the default values for the VMA study:
You may change the InputField for a study with multiple Plot Names as well as the study parameters, in the syntax as the following examples show:
Aggregation:function (source.InputField, value, value, value).PlotName
=D:VMA ('IN A0'.HIGH, 18,SIMPLE,12,ROLLING,15,EXPONENTIAL).PLOT1
=D:VMA ('IN A0'.LOW, 9,SIMPLE,10,SIMPLE,12,SIMPLE).PLOT1
=D:VMA ('IN A0'.CLOSE, 10,EXPONENTIAL,10,SIMPLE,10,ROLLING).PLOT2