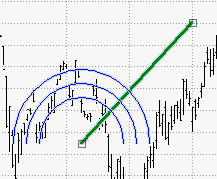
The Fibonacci Arc is drawn by placing a trendline between two extreme points (usually a trough and opposing peak). The radius of the arcs can be increased by pulling the control line End Point (Ending Price x time) away from the Beginning Point (Beginning Price x time).

Centered on the second extreme point, three arcs are displayed. The arcs intersect the trendline at 38.2%, 50.0%, and 61.8% - at the Fibonacci levels. To move the Fibonacci Arc, position the cursor in its center (the cursor changes to a hand). You can now drag it to a new position on the chart.
As prices approach the arcs, the analyst anticipates support and resistance to interpret Fibonacci Arcs. Investors usually draw both Fibonacci Arcs and Fibonacci Fans to predict support and resistance points where the Fibonacci studies cross.
Note that at the points where the arcs cross, the price data varies depending on the scaling of the chart, because the Arcs are drawn so they are circular relative to the computer screen.
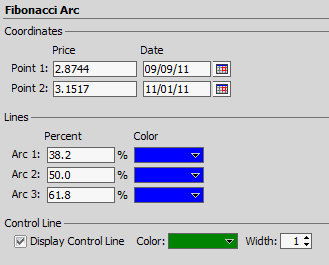
The Fibonacci arc has several properties that can be changed. To access the options list, right double click on the arc. Click on Object Properties. The following pop up window appears.

|
Property |
Description |
|
Coordinates: Point 1 is where the Fibonacci Arc is initiated by the drawing tool. Point 2 is the point on the control line where the line drawing was stopped -changing this point will affect all other lines equally. |
|
|
Price |
The price value on which the arc is currently positioned. |
|
Time |
The time value on which the arc is currently positioned. |
|
Up to three lines can be displayed for a Fibonacci Arc. For each line, you can set these properties:
|
|
|
Angle |
The Arc percentage of the Control Line length value |
|
Color |
The color of the line. Click the Color box to choose a color from the drop-down list. |
|
Width |
The width of the arc line, between 1 - 10. |
|
Arc 1 is the first arc's intersection point with the control line (default is 38.2%). Arc 2 represents the second arc's intersection point with the control line (default is 50.0%). Arc 3 is the third arc's intersection point with the control line (default is 61.8%). |
|
|
Display Control Line |
Put a checkmark in the Display Control Line box to display the control line on the chart. |
|
Color |
The color of the line. Click the Color box to choose a color from the drop-down list. |
Click Apply. Click OK. When done, save the workspace.