Each chart can contain its own properties, such as the font size and type, and foreground and background color. When changing chart properties, you may apply the settings to the current window, all windows on the page, or all windows.
|
Option
|
Description
|
|
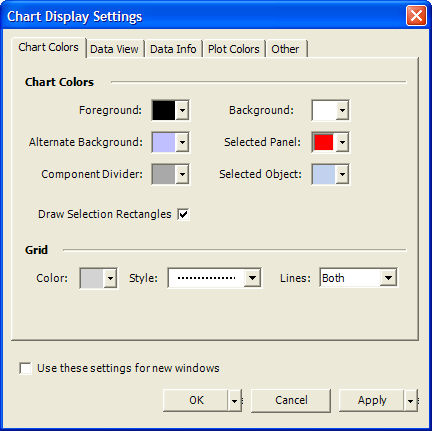
Chart Colors
|
|
Foreground
|
The color of the font displayed in the time and price scales.
|
|
Background
|
The underlying color of the chart.
|
|
Alternate Background
|
You may choose a second background color to help distinguish trading sessions on an intraday chart, months on a daily chart, and years on weekly and monthly charts.
For example, the dialog box above indicates the chart will use black as the Background, and navy as the Alternate Background. When looking at a 60-minute intraday chart for the CME E-Mini S&P, each trading session (8:30 - 15:30) is displayed using these two background colors, as shown here:
|
|
Selected Panel
|
The color used to highlight a selected pane on the chart.
|
|
Component Divider
|
The color of the pin-lines used to divide the chart image and the price and time scales.
|
|
Selected Object
|
The color used to highlight a selected object.
|
|
Draw Selection Rectangles
|
When checked, the color identified in the Selected Panel field will show you which pane you are working in. For example, the TOP pane (symbol DJIAY) is the active pane, identified with the Red Selection Rectangle:
|
|
Grid
|
|
Color
|
The color applied to the horizontal and vertical grid on the chart.
|
|
Style
|
The line style applied to the horizontal and vertical grid on the chart.
|
|
Lines
|
Defines whether horizontal, vertical, or both types of lines will appear on the grid.
|
|
Default
|
|
Use these settings for new windows
|
When checked, these settings will be applied to any new chart window created.
|
|
Option
|
Description
|
|
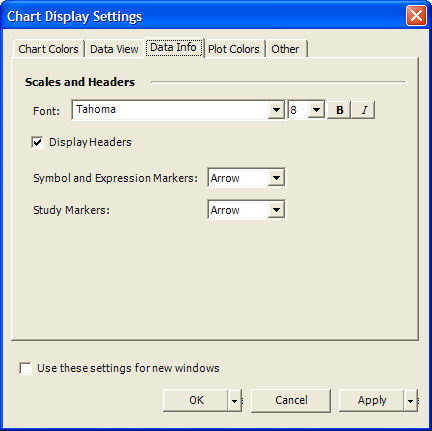
Scales and Headers
|
|
Font
|
Specify the font type and size which will be applied to the headers, price and time axis.
|
|
Display Headers
|
When checked, the chart header will appear. The chart header displays the Open, High, and Low for the symbol.
|
|
Symbol and Expression Markers
|
Specify the price marker type in price scale (y-axis) for symbols and expressions.
|
|
Study Markers
|
Specify the price marker type in price scale (y-axis) for studies.
|
|
Default
|
|
Use these settings for new windows
|
When checked, these settings will be applied to any new chart window created.
|