FutureSource 3.70 Release Notes
Content
Opis Racks
OPIS is the most widely accepted fuel price benchmark for supply contracts and competitive positioning. Nearly 100 billion gallons of fuel are pegged annually to OPIS rack, retail and spot prices for U.S. gasoline, diesel, LP-gas, jet fuel, crude, propane, feedstock’s, residual fuel, kerosene, ethanol and biodiesel.
OPIS is relied on as the benchmark because OPIS remains completely unbiased and independent. OPIS has no stake in fuel transactions, is not funded by oil industry initiatives, and strictly adheres to antitrust guidelines determined by independent legal counsel.
OPIS Benchmarks are relied on by:
Every major and independent oil company
Jobbers, dealers, c-stores and retail service stations
Nearly every major metropolitan transit authority, school, utility, and railroad system
Most commercial aurlines, truckstops and fleets
U.S. federal, state, municipal and county government
The DESC for a vast majority of fuel used for U.S. military operations
Price Discovery
Every day, including Saturdays, OPIS updates its wholesale terminal prices from hundreds of sources for its nearly 400 wholesale rack price points. For a detailed description of the methodology used to source OPIS racks please refer to:
http://www.opisnet.com/about/methodology.aspx
For a list of the rack locations covered please refer to:
http://www.opisnet.com/resources/RackCode.aspx
Time Stamp (all times are ET)
9am - OPIS wholesale terminal prices for gasoline, distillate, and other products are updated and ready for release.
10am - OPIS contract summary data used for benchmarking is available. The data includes the Contract Average which is a gross price that OPIS has had since 1995. OPIS provides a Contract Low and Contract High as well as Contract Net Average, Contract Net Low and Contract Net High pricing. Branded and Unbranded numbers are also available as Contract prices.
5:59pm - OPIS archives the closing rack price database for that business day. The current day's history is available the next business day.
11:59pm - OPIS Calendar-Day Average rack prices are a snapshot of the average of all supplier postings in each OPIS rack market at 11:59 p.m. eastern time. The snapshot includes all price moves from 12:00 a.m. (midnight) until the file is frozen at 11:59 p.m. (Example: The Jan. 3 Calendar-Day Average encompasses all price moves that were made at 12:00 a.m. on Jan. 3 up through 11:59 p.m. on Jan. 3. Hence, it is an average of all prices on that calendar day.)
Rack Formats
OPIS Standard Display – Provides one price per product, per supplier in each market, even when suppliers post at multiple terminals. We select the primary terminal for each supplier, so the OPIS averages that are so critical for benchmarking and market analysis are not skewed.
OPIS Terminal Display – Shows product prices posted for every supplier at all terminals in a given location for total price transparency and includes the location and owner.
Index Data - Natural Gas Exchange
This data covers index data for Canadian Natural Gas, Basis locations within the US and Canadian Crude oil spot prices (AECO). For a complete description of the methodology used for calculation of the NGX Index data, please refer to:
http://www.ngx.com/pdf/NGXPIMG.pdf
Informa Agra
Coverage of over 700 global OTC, cash and exchange commodity prices including grains, oils, oil seeds, feeds and nuts. Content is sourced from the market acknowledged and recognised Public Ledger and coverage includes, where available, history out to 2 years. With the dynamics of the whole Agricultural market changing this provides key insight to the markets across the world and key drivers for the exchange traded instruments.
Functionality
Macro Functions - The list of macro functions has been expanded to include a host of additional popular expressions. Functions such as:
Visit the Function Library for a complete list.
Bulk Window Image Export - You can now export all images from a page with one click. This is done by selecting Export All Images from the File Menu.
Historic Implied Volatility - The Historic Implied Volatility study can now be displayed within the data table. This is done by selecting the study from Studies on the Context Menu of the data table.
External Data - The External Data framework has been enhanced to support newer Excel file formats from Excel 2007 and Up.
FutureSource 3.60 Release Notes
Content
Argus Media - The Argus Media content set represents assessments and news
that reflects real trading in the global energy and commodities markets. Argus produces
detailed, exclusive information and price assessments for the energy and commodity
markets, covering crude and petroleum products, natural gas and LNG, electricity,
coal, emissions, biomass, biofuels, fertilizers and transportation. Many Argus assessments
are considered benchmarks and are used extensively by traders in the global energy
and commodities markets.
Opis-Non-Rack - FutureSource users will now be able to view OPIS Feedstock, LPG,
Spot Prices and RINS. OPIS spot gasoline, diesel and jet fuel prices are highly
benchmarked in the U.S. West Coast and other key markets. OPIS's refinery feed stocks
and LPG prices are also considered a preferred benchmark by many U.S. and international
traders. Time series history dating back to January 1, 2012 is available in FutureSource
for all OPIS spot prices.
Canadian Long Forwards - Canadian FX Long Forward data going out 10 years is
now available in FutureSource from Cougar Capital. These quotes are represented
as both Outright quotes and Percentage in Points (PIPs).
Functionality
Symbol Lookup – Symbol lookup has been re-designed to provide an easier mechanism
to locate content. This includes a dynamic tree structure to quickly narrow search
results
Symbol Linking – Link symbols within the Quote Board to many of your other windows
such as Chart, Detailed Quote, Market Depth, Data Table and Time & Sales
Expression Shortcuts – You can now import/export your personal Expression Shortcuts
from FutureSource, this allows user to share with other users
Expressions/Functions – Now support the data point “Recent” for its calculations.
Detailed Quote – A new window that provides complete flexibility for analyzing
data points on a specific commodity
VWAP Calculator – A new window that allows users to perform custom VWAP calculation
Charting Enhancements – Numerous enhancements have been made to charts. This includes:
Historical Implied Volatility Study
Symbol Descriptions
Chart Templates
External Data – There is now support for the newer Excel file format (.XLSX)
when using the External Data linking feature.
News Display – Assign custom color properties to Dow Jones News Headlines that
are flagged as “Hot News” by Dow Jones.
OptionWorks – Additional contents are now supported within OptionWorks. Options
on Cocoa, Coffee, Rapeseed, Wheat, Corn and Sugar from NYSE/Euronext are now available.
Excel RTD Add-in – The Excel Add-in has been enhanced to provide greater flexibility
with integrating Real-time and Historical data into your Microsoft Excel environment
New Ribbon Menu for Excel 2007 and Above
Date Range Filtering
Time Range Filtering
Count filter for pulling time series that is relative to a specified number of bars
Additional Fill options for time series; Fill Forward, Fill Backwards, Interpolate
Ability to have Real-time or Historical tables built with static symbols/fields or
cell referenced points
Have time series return in ascending or descending order
FutureSource 3.50 Release Notes Feature Overview Video
Data Content
Content - New Fixed Pages (WSN 101) for display Platts PGA Master Index Page
A new master Platts Index page has been added to Workstation News. In Fixed Pages, Select the “WSN Workstation News” service and enter page “101” to get to the Platts PGA Master Index Page. This page provides a master index with links to easily navigate the Platts Global Alerts (PGA) content.
Content - ICE Futures Market Depth
Market Depth is now available for ICE Futures Europe (IPE) and ICE Futures US(NYBOT). Depth of Market is displayed by clicking on Market Depth button on the main tool bar and entering the appropriate symbol (BRN 1!-ICE).
Content - Argus US & European Product Sets
Argus US Products set represents assessments that reflect real trading in the US energy markets. The data represents transactions throughout the trading day shown as low and high and as volume weighted averages of deals done. Markets covered include Gasoline, Jet, Naptha, Diesel, Fuel Oil, VGO and Ethanol. The Argus European Products set is the source of the Argus Rotterdam Eurobob gasoline assessment, which is the standard index for the Northwest European physical and swap markets. Price assessments include intraday bids and offers covering Gasoline, Jet, Naptha, Gasoil, Fuel Oil and VGO. This data requires customers to have a subscription with Argus in order to be viewed in FutureSource.
Content - EIA Petroleum & Natural Gas Inventory Statistics
The EIA provide weekly estimates of Crude Oil and refined product inventory statistics as well as weekly estimates for Natural Gas storage in the United States. These statistics are released weekly on Wednesday’s at 10:30am for the Crude and Refined Products and on Thursday’s at 10:30am for Natural Gas storage, unless there is a holiday. The weekly release is for statistics as of the Friday from the previous week. Unexpected movement in these statistics can have an immediate impact on the price of Crude Oil and Natural Gas.
Content - USDA Agricultural Prices
The USDA release daily prices for regionally delivered agricultural markets including Soybeans, Red Wheat and Corn. These USDA cash prices are now available in FutureSource
Functionality
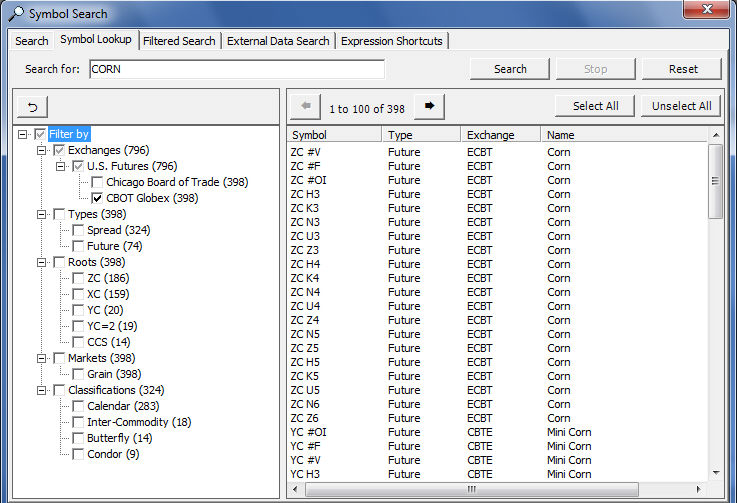
Symbol Lookup - New tree structure symbol search
FutureSource 3.5 introduces new symbol look-up capabilities. This new symbol lookup gives users the ability to select “Symbol Look-up” from the Symbol Search dialogue box available from the Quote Board, Quote Grid, Chart and Data Table displays. Within Symbol Look-up, users can narrow their search by Exchange, Instrument Type, Symbol Root, Type of Market or Classification. For example, an unfiltered search for “CORN” returns many symbols. You can further narrow the search results by filtering the search using selections in the tree. “Exchanges -> U.S. Futures -> CBOT Globex" narrows the results further. Selecting additional filters will continue to narrow the symbol look-up results.
News - Integration of topical and trending news for the Energy, Agriculture and Metals markets
When entitled for the Commodities & Energy Market Insight service, from the News Menu, there are three new selections: Energy Market Insight, Agriculture Market Insight and Metals Market Insight. When selected, each will open a widget in a browser that will contain a topical “Heat Map”, top news for the market and an event timeline.
Option Board - Ability to view all months of an option in tabs in Option Board
FutureSource 3.5 now allows a user to display all months or a range of months for a selected futures option. Tabs can be created by entering “*ROOT” into the Option Board to list all months of a futures option. If you are interested in only a specific range of options months, enter “*ROOT Month Number-Month Number”. For example *CL 1-5
Option Board - Right Click Functionality in Option Board
Right Click functionality works from any column on the Option Board. It is no longer limited to the Symbol column.
Chart - Ability to chart Expired Strip Functions
User can now chart expired strips for all strip functions including SUMMER, WINTER, ANNUAL, QUARTER, and SEMIANNUAL. The syntax is exactly the same: =FUNCTION(ROOT, Expired 4-digit Year). For example, to chart the Summer Natural Gas strip from 2010, enter =SUMMER(NG, 2010) in a Chart window.
Chart - New Tick Bar Charts
Users can now view tick charts as a series of user defined bar charts. The bars can be defined by:
The number of ticks per bar (20T = 20 ticks per bar)
An interval of price changes per bar (20P = 20 price changes per bar)
A volume per bar (20V = ticks with an accumulated volume of 20 per bar)
A seconds time parameter per bar (20S = 20 seconds of time interval between each bar).
Select these new intervals by Right Clicking the interval drop down arrow on the toolbar.
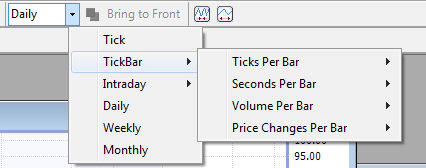
Or by manually typing the numerical interval and letter code [T, P, V, or S] into the interval drop down on the toolbar. For example type:
500T for a 500 tick bar chart.
![]()
Chart - User Defined Chart Tracking Default
The user now has the ability to set system level chart tracking default within FutureSource. Tracking can always be turned on or it can always be turned off. To set the tracking default, select Preferences from the main tool bar and from the drop down menu, click on Initial Chart Tracking and select the desired default tracking parameter for your charts.
Time & Sales - Server Side Tick Filtering
A performance enhancement now lets you quick view tick data filtered by Trades, Bids, and/or Asks in Time & Sales window.
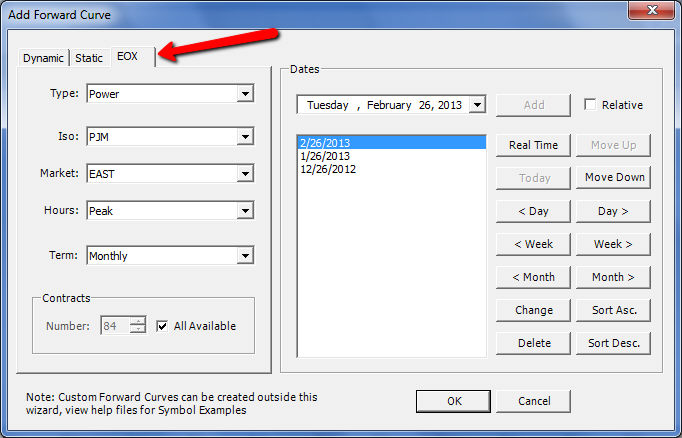
Fixed Chart - Forward Curve Display of EOX Forward Curve Data
Natural Gas and Power Forward Curve data from EOX can now be displayed as a Fixed Chart Forward Curve, when entitled for EOX forward Curve data. To create a forward curve, click on the Fixed Chart button on the tool bar. In the Fixed Chart window, “Right Click” and select “Add Forward Curve” from the menu. From within the Add Forward Curve window, select the EOX tab.
Quotes Window - Previous Net Change Field
A new display field is now available in FutureSource 3.5 which enables the display of the net change of the previous trading day settlement and the one from the session prior to the previous (Previous Settlement – 1).
To Display the new field, right click on the column headings in a Quote Window and select Columns. From the drop down box, select Customize. Then Add the Previous Net Change field to your Selected aspects.
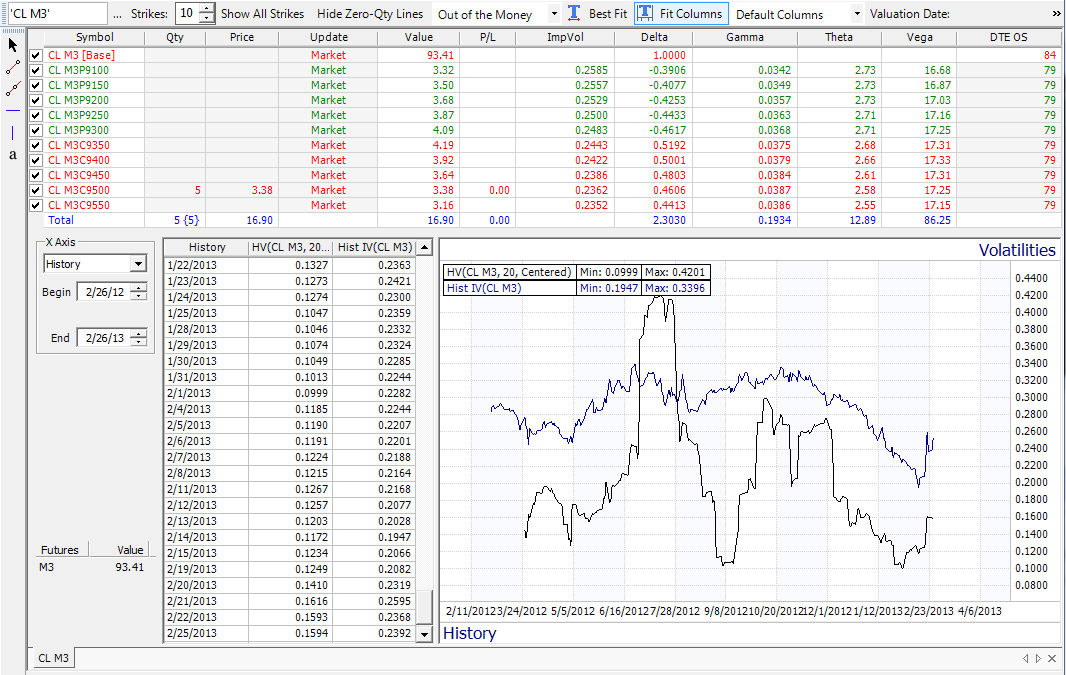
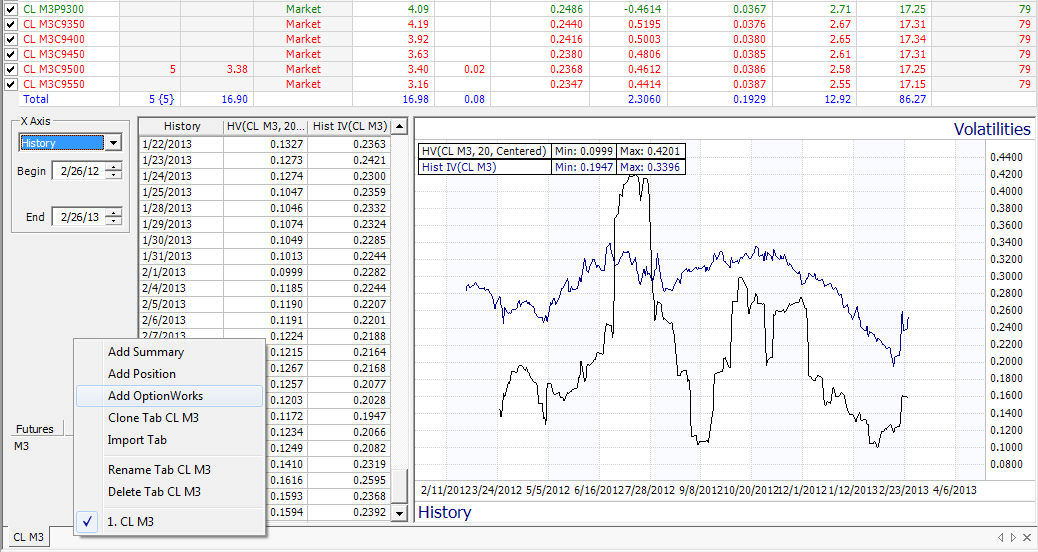
OptionSource - Enhancements including the ability to chart historical implied options volatilities
FutureSource Release 3.5 introduces some exciting new enhancements to OptionSource including new skew analysis and the ability to compare the historical volatility of the future versus the at-the-money historical implied volatility of the strike.
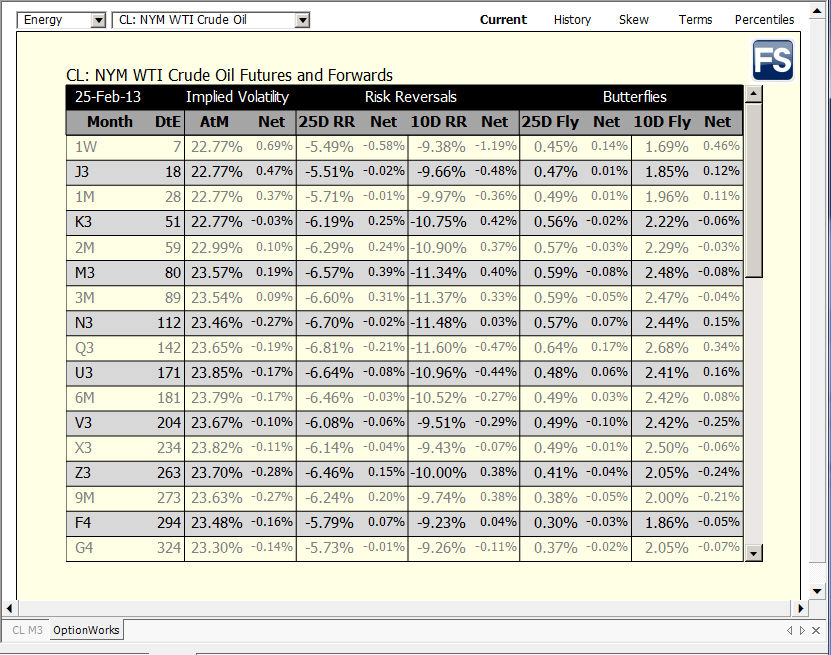
OptionSource - New OptionWorks module in OptionSource OptionWorks Guide
Included in the new release of OptionSource is a new widget called OptionWorks. OptionWorks is added to your OptionSource display as a new tab. To add the OptionWorks tab, Right Click on the tabs bar at the bottom of the OptionSource display and select Add OptionWorks
RTD - RTD support for 64 bit Excel
FutureSource 3.5 is now fully campatible with the 64-bit version of Microsoft Excel.
FutureSource 3.41
Trading - FutureSource Trader - FAQ's
FutureSource Trader is an add-on service, featuring integration of CQG's order routing capabilities within FutureSource. It provides a core workflow capability for those who trade or broker exchange listed futures, future options, and future spreads. FutureSource Trader provides access to multiple clearing firms and accounts which can be segregated for different commodities or to route orders on the behalf of customers.
Quotes - Spread Matrix Window
A new window for displaying Calendar Spreads for Futures.
New Rolling Symbols for Calendar Spreads
Rolling symbols will change to the next active Calendar Spread contract after expiration. Example symbols are:
WTI Crude Oil Calendar Spread is CL 1!:2!
Brent Crude Oil Calendar Spread is BRN 1!:2!-ICE
Upon symbol entry, the symbol will display Month & Year code instead of nearby code, similar to rolling futures symbols.
Quotes - Auto-list Calendar Spread Symbols
Quickly insert Rolling Calendar Spread symbols into a Quotes window. Entering **ROOT will insert all possible Calendar Spreads with a 1 contract difference. You may also insert a specific number of spreads by including a numerical range. Entering **ROOT 1-12 will insert the 12 nearest Calendar Spreads for the ROOT symbol.
Quotes - Calculated Settlements for Calendar Spreads
New Settlement value for Calendar Spreads will be available once New Settlement value is present for the individual Future contracts.
Quotes - New Column Field - SettleChg
SettleChg is the difference between New Settlement and Previous Settlement. SettleChg is cleared (blank) until the current days settlement value is available, similar to New Settlement. Within the Spread Matrix window, SettleChg is abbreviated as SChg.
Seasonal Charts - Daily granularity in start and end dates
Define Start and End Dates when creating a Seasonal Chart. In previous versions, you were restricted to defining Start and End Months.
Studies - Correlation Study enhancement
If your chart contains 2 symbols, you will have the option to apply the Correlation Study to the symbols within the chart.
Chart - Remove All Studies and Drawing Tools option
Quickly remove all Studies and Drawing Tools from a Chart via the Right click menu option Remove All Analytics.
Fixes and Other Items
Seasonal Charts improved to handle Leap Year.
Fix for Forward Curve Charts of User Defined External Data.
FutureSource 3.40
Charting - Bar plots for Expressions
Formulas and Expressions can display Bars or Candlesticks when charted. Also, Open, High, Low, and Close values are displayed in Data Table window for expressions.
Quotes - Futures Autolisting
Entering *ROOT symbol into the Quotes window will insert all the active futures contracts into the Quotes window. For example, *CL will insert all available Light Sweet Crude Oil (WTI) futures into the Quotes window.
Quotes - Create Formulas and Expressions with mouse clicks
Symbols and Symbol fields can be added to your Formulas with easy mouse clicks.
Quotes - New Macro Expressions for Strips
New Quarterly and Semi-Annual strip functions.
=QUARTER1 is January, February, & March
=QUARTER2 is April, May, & June
=QUARTER3 is July, August, & September
=QUARTER4 is October, November, & December
=SEMIANNUAL1 is January, February, March, April, May, & June
=SEMIANNUAL2 is July, August, September, October, November, & December
Studies - New Studies - Bollinger Bands %B, Ichimoku, Pivot Points, and TEMA added.
Studies - Historic Volatility Study available in Quotes window, Data Table window and RTD symbol links
News - Search Dow Jones News by Dow Jones Category Codes
A drop down list contains popular DJ Categories or users may enter the DJ Category such as n/HOT
Symbol Search - Type Ahead Symbol Lookup from Charts, Data Table, and Time & Sales windows
Type Ahead Symbol Lookup provides instant feedback as you are typing a symbol or symbol's description by displaying a list of matching symbols. You further filter this search by symbol type such as Futures, Index, Stock, Fund, Forex, and ETF.
Market Depth - NYMEX and COMEX Market Depth is available
Time & Sales - Identifier and Sequence Number available in Time & Sales
Fixes and Other Items
Charts - Daily charts of 1 Month forward symbols fixed, such as EUR M1-FX or LIB M1-FX
Charts - Tick chart of NYSE Indices goes blank with first real-time update ( i.e. $SPX, $TICK )
Charts - Correct pricing format is applied to expired futures symbols ( i.e. ZB Z2010 )
Data Manager - Start menu shortcut for Data Manager fixed
Fixed Pages - Removed inoperable 2 letter Platt's service codes from "Select a Service" drop down list.
Export - Error when exporting Future Spread symbols containing colon ":" fixed
Installer - Manage application firewall permissions during installation, so users with basic rights are not prompted to "Allow" FutureSource or Data Manager the first time they run
Market Depth - Apply Display Settings to All Depth Windows fixed
Market Profile - Open Market Profile window from right-click, context menu of a symbol fixed
News - Removed the discontinued NewsPlus Capital Markets Report service from News drop down
OptionBoard - All analytics do not fill in for all symbols fixed
OptionBoard - Clear Down status is properly applied when Snapshot is initially turned on
OptionSource - Print Preview exception fixed
OptionSource - Contour settings keep state when Analyze is turned off and back on
OptionSource - Summary Tab pages re-expand after page is hibernated
OptionSource - Single keystroke to change Update Mode is fixed
Quotes - Exception when a single letter symbol is dragged and dropped. ( i.e. C , T , F )
Quotes - Greeks and Analytics quote columns are properly blank for Futures as these fields are specific to Future Options.
RTD/DDE - Amerex specific fields now populate with RTD & DDE
Symbol Search - Exception when symbols are returned without symbol type fixed
Studies - Studies with Displacement now show most current value in Chart Header and Quotes windows.
Time & Sales - Beacon time is used for order of ticks in Time & Sales. The associated Exchange time is viewable in a tool tip by mousing over Time field
Time & Sales - No Filter is applied to new Time and Sales windows by default.
Weather Maps - Delayed Weather Maps error fixed
FutureSource 3.30
RTD (RealTimeData) function support with Excel
Create streaming quote RTD links from Quotes Board, Option Board, or OptionSource windows. Or create RTD Quote Tables and Historic Tables with cell referencing within Excel using the Interactive Data RTD Toolbar.
Initially available for CME and CBoT Globex contracts. Market Depth is an add-on service, please contact your account rep if interested in subscribing to Market Depth.
Mobile Device - Shared Symbol Lists
Create, modify, and share up to 5 symbol lists of 40 symbols each with your Interactive Data Mobile device.
Fixed Chart Window
The Fixed Chart window dynamically resizes its contents to fit as the window is resized. The Fixed Chart window replaces the Forward Curves window, and supports both Forward Curve and Seasonal Chart plots.
OptionSource 2.0
Market Update Mode - Market = (Bid+Ask)/2 ; If Bid is blank, Market = Ask ; If Ask is blank, Market = Bid ; If Bid & Ask are blank, Market = Recent
Quickly Include or Exclude individual Positions from Tab Totals
Quickly Include or Exclude individual Positions or entire Tabs from Summary Tab Totals
Hide Zero Qty Rows in Position Tab
Additional Columns - Market, Size, Bid/Ask, $Change, $Last, $Delta
Printing - Choose what frame is printed - Position Page, Analyze Graph, and/or Analyze Table
Dow Jones Ag Fixed Story Index Pages
Available via the Fixed Pages window under the following page numbers:
ODJ 1 - Commodity News and Weather
ODJ 2 - Softs
ODJ 3 - Cattle – Hogs – Poultry
ODJ 4 - Livestock Auctions – Livestock and Meat
ODJ 5 - Soy – Corn – Wheat – Rice
ODJ 6 - Grains & Oilseeds
ODJ 7 - Grains Bids – Basis – Cash
Relative Date plot - Create Forward Curve using a rolling displacement from the present date.
Create Static and Historical Forward Curves using the Forward Curve wizard.
Options Enhancements
Market field can be set in Black Scholes model parameters. Market = (Bid+Ask)/2 ; If Bid is blank, Market = Ask ; If Ask is blank, Market = Bid ; If Bid & Ask are blank, Market = Recent
Quotes Board Enhancements
Copy & Paste symbols into the Quotes Board from Excel, or a text file
Previous column will calculate in User Expressions. Change is calculated Last - Previous in User Expressions.
Symbol Search Enhancements
Futures Spread Symbols are ordered by expiration and grouped by strategy types in symbol search results.
"By Description" results improved.
Fixes and Other Items
Added NewSettlement to available columns list in Option Board
Studies can be applied to Custom Toolbars
Previous Release Notes: